

Adoption Metrics Leaders Should Track: Is Your Analytics Actually Used?
Many organizations invest heavily in analytics, yet few ask the most important question: Is anyone actually using the insights? Tracking adoption metrics goes beyond counting logins—it’s about measuring how analytics influences decisions, workflows, and outcomes. Leaders who focus only on technical performance miss the real value: empowering teams to act with clarity and confidence. This article explores the key adoption metrics that reveal whether your analytics is truly embedded in your business or just sitting on the shelf.For years, businesses have invested heavily in analytics platforms, dashboards, and reporting tools—convinced that data would revolutionize their decision-making. But here’s the uncomfortable truth: buying analytics software doesn’t guarantee a data-driven organization.
The real question every leader must confront is not “Do we have analytics?” but “Are our analytics actually being used to drive decisions?”
Without adoption, even the most advanced dashboards are nothing more than digital wall décor. True impact lies in how widely—and how effectively—teams across your organization embrace analytics as part of their daily workflow.
Why Adoption is the Real ROI of Analytics
It’s easy to measure the cost of technology. Licenses, infrastructure, integrations—all appear on the balance sheet. But the real return on investment is invisible unless you track adoption.
A powerful analytics system that goes unused is no better than having no system at all. Adoption determines whether:
- Insights flow seamlessly into decisions
- Teams feel empowered by data rather than intimidated by it
- Your culture shifts from gut-feeling management to evidence-based leadership
Analytics adoption is not a side issue—it’s the bridge between investment and impact.
5 Adoption Metrics That Reveal the Truth
To uncover whether your analytics are driving value, leaders need to look beyond “number of dashboards built” and instead track adoption through these critical lenses:
1. Active User Rate
How many people in your organization are actively engaging with analytics tools on a daily or weekly basis? Occasional logins don’t signal true adoption—consistent use does.
2. Depth of Usage
Are users simply opening dashboards—or are they drilling into data, customizing reports, and asking new questions? True adoption is seen in exploration, not just observation.
3. Decision Influence Rate
Analytics have no value if they don’t inform decisions. Leaders should measure how often data is cited in meetings, referenced in reports, or used to justify strategy shifts.
4. Cross-Department Engagement
If analytics remain the domain of IT or finance, adoption is incomplete. A healthy sign of maturity is when marketing, HR, operations, and frontline teams all rely on analytics to guide their choices.
5. Time-to-Insight
Even with high adoption, delays can kill momentum. Track how quickly users can move from data access to actionable insight. Speed signals usability, and usability fuels adoption.
The Hidden Barriers to Adoption
Even with the right tools in place, adoption doesn’t happen automatically. Leaders often underestimate cultural and operational barriers such as:
- Complex dashboards that overwhelm instead of clarify
- Lack of training, leaving teams unsure of how to leverage analytics
- Data silos, making insights fragmented and inconsistent
- Poor executive modeling, where leaders themselves fail to use data visibly in decision-making
Adoption requires not just technology, but change management, leadership buy-in, and intentional data literacy initiatives.
From Metrics to Momentum
Tracking adoption metrics is only the first step. The real value comes from acting on them. That means:
- Redesigning dashboards for clarity and usability
- Tailoring analytics for different user groups
- Providing continuous training and support
- Embedding analytics into daily processes and strategic discussions
When adoption becomes part of the organizational DNA, analytics shift from being tools to becoming trusted advisors.
The Vividx Perspective
At Vividx, we believe analytics should not just exist—they should transform. Adoption is the difference between dashboards that collect dust and dashboards that change the trajectory of your business.
By helping organizations track and improve adoption metrics, we ensure that analytics are not just tools for analysts, but everyday instruments for leaders, teams, and decision-makers at every level.
Because in the end, the real measure of success is not whether you have analytics, but whether your people are living by them.
Similar publication
 AI in Real Life: Turning Prediction into Progress
Predictive intelligence is only powerful when it drives action. AI forecasts mean nothing if they don’t change behavior. At Vividx,…
Read More Beyond the Creative: The Blueprint for a High-Performance, Data-First Marketing Team
Is your marketing team fueled by intuition or intelligence? In 2026, the gap between creative brilliance and market dominance is…
Read More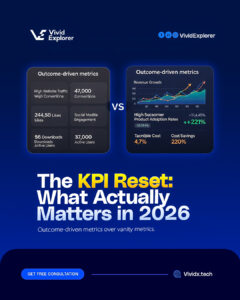 The KPI Reset: Why Your "Success Metrics" Might Be Lying to You in 2026
Is your data telling you the truth, or just what you want to hear? In 2026, many businesses are "rich"…
Read More The Death of the Dashboard: Why 2026 is the Year of Embedded Intelligence
Make Data Invisible, But Omnipresent The most powerful technology is the kind you don't even notice because it’s working for…
Read More