

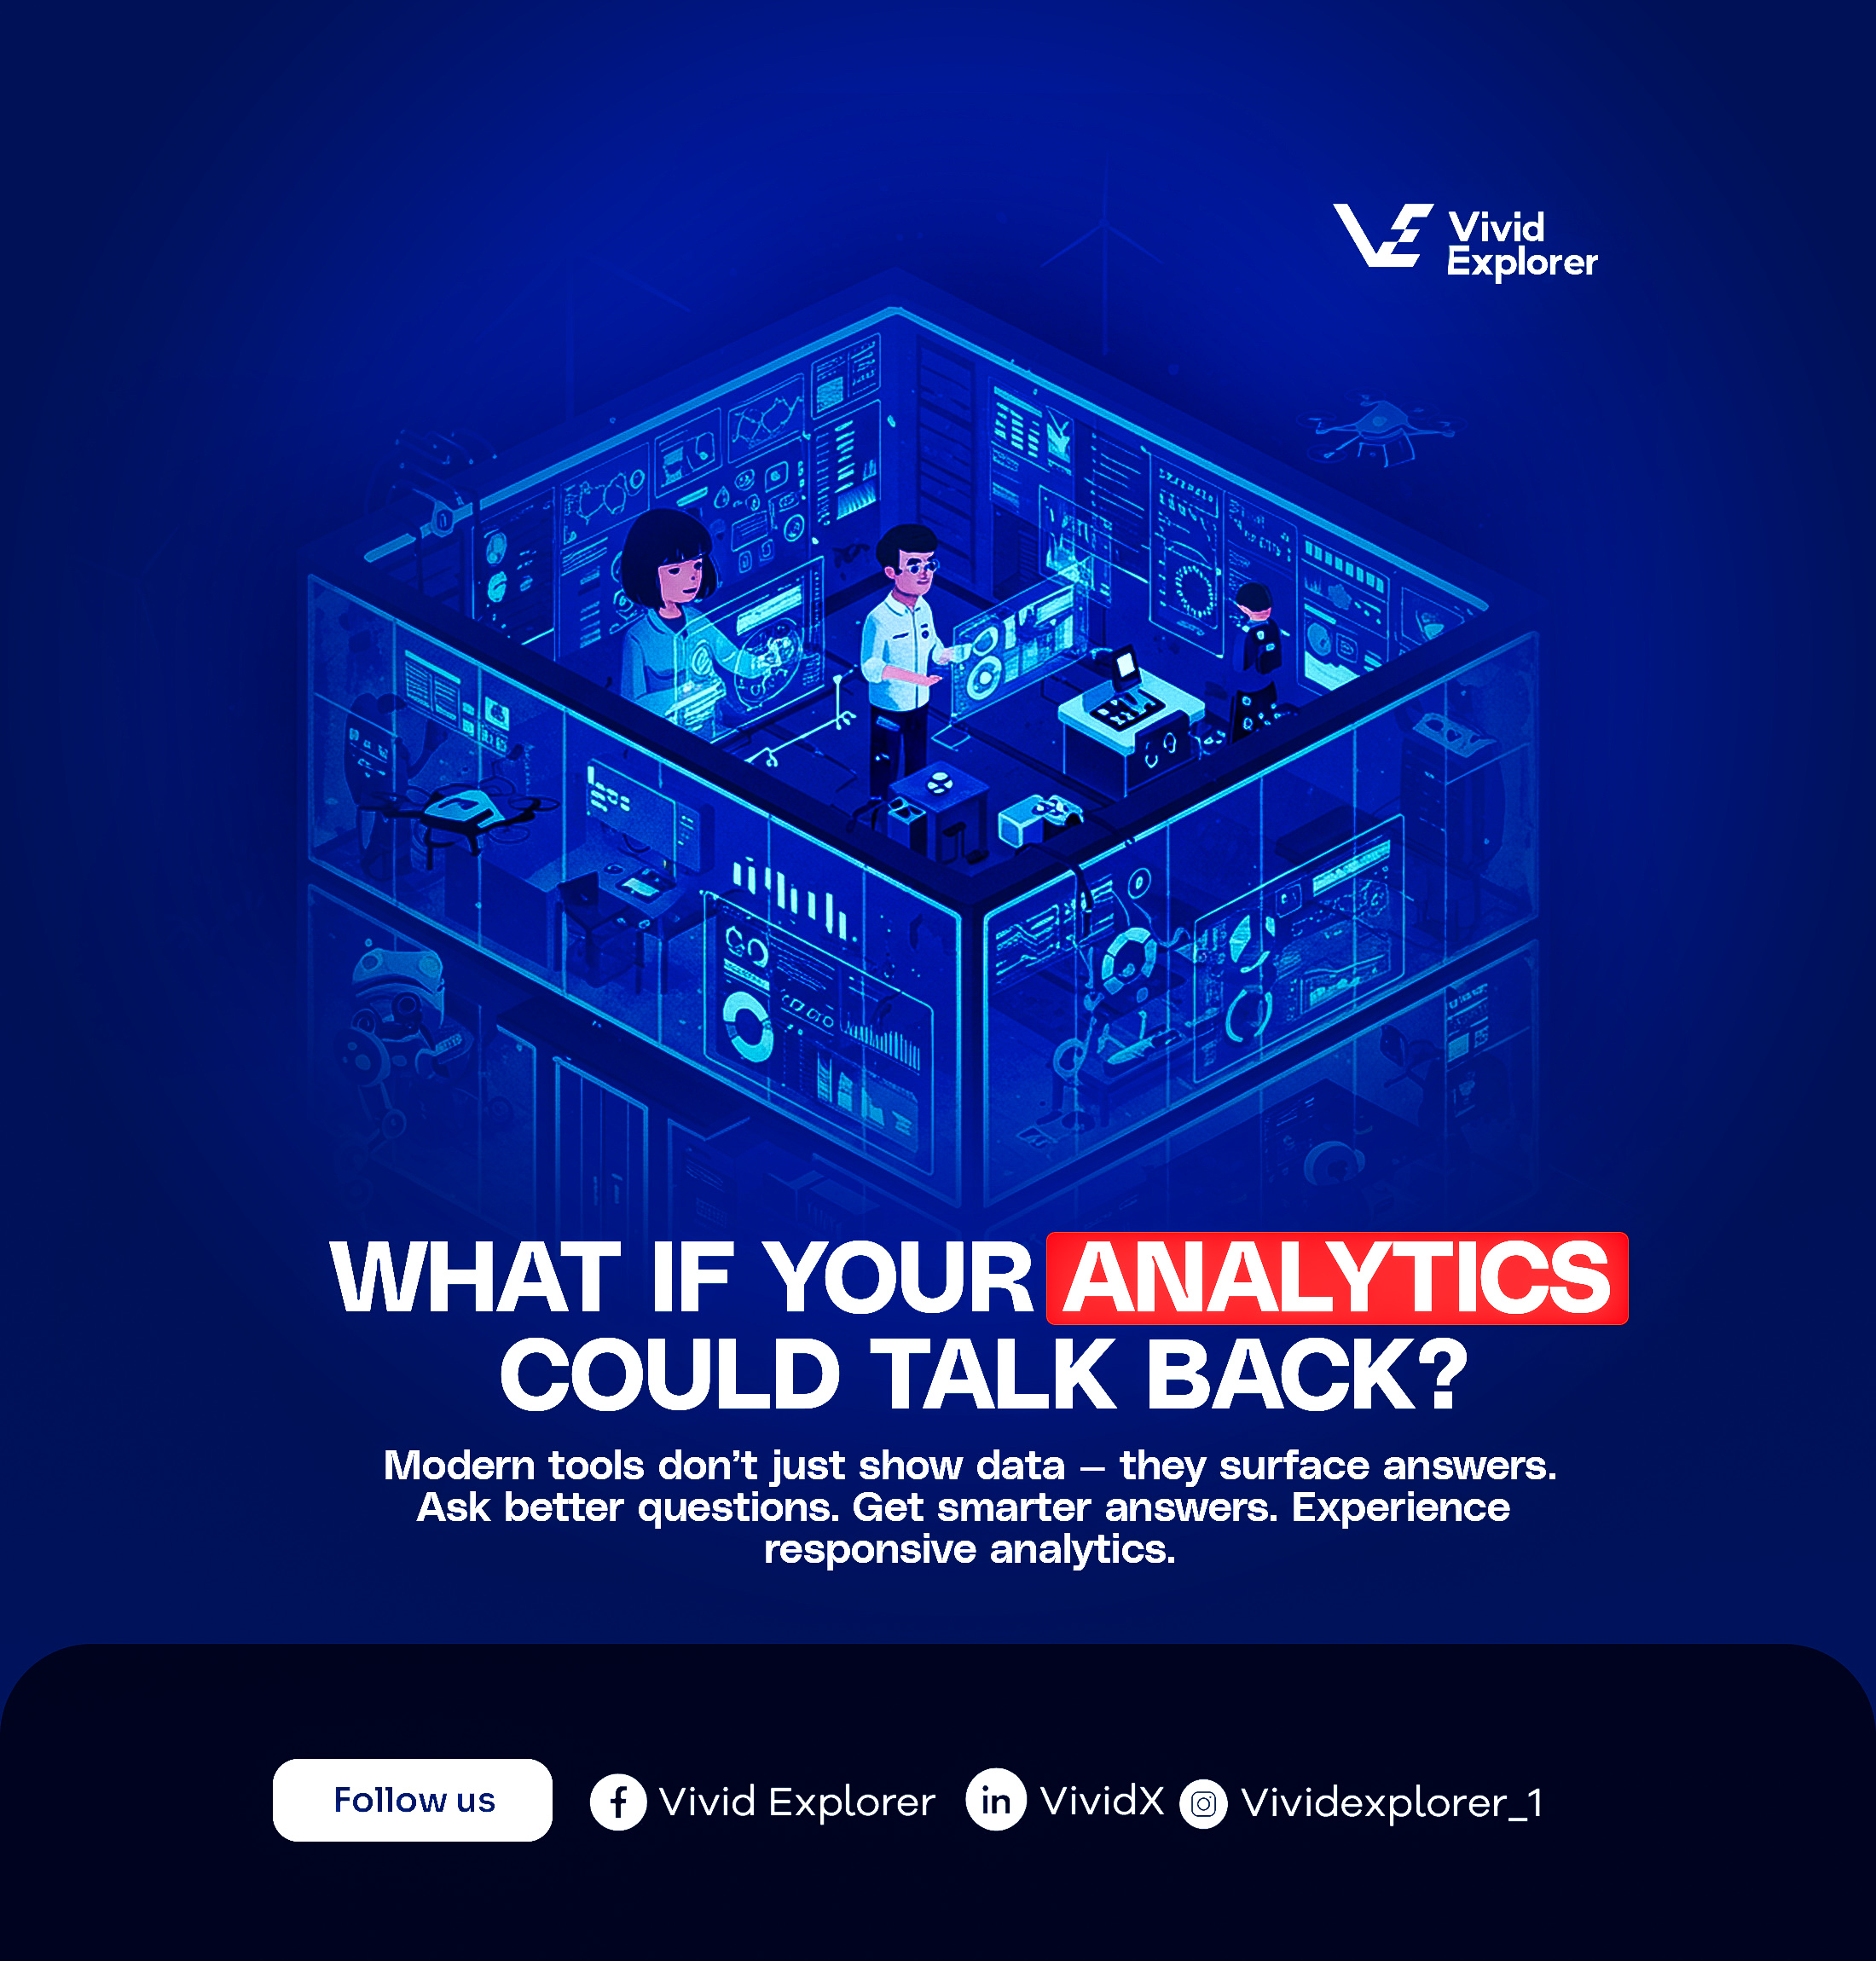
What If Your Analytics Could Talk Back?
What if your dashboard didn’t just show data, but spoke back with insights, predictions, and next steps? At Vivid Explorer, we’re transforming analytics from static visuals into responsive systems that think, guide, and accelerate decision-making. If your dashboard isn’t answering your business questions, it’s not doing enough.Imagine walking into a meeting, looking at a dashboard, and instead of asking “What does this mean?”, it asks you:
“Do you want to know why your sales dipped in Region C last week?”
“Would you like to explore what’s driving customer churn in Segment B?”
“Want a prediction of how Q3 will close based on current patterns?”
Now you’re not just viewing data. You’re having a conversation with it.
Welcome to the era of responsive analytics, where your dashboards don’t just show numbers, they surface answers, spark ideas, and accelerate decisions.
At Vivid Explorer, we’re building dashboards that don’t sit still — they engage.
The Problem: Traditional Dashboards Are Too Quiet
Most dashboards are passive.
They show what happened, but they rarely tell you why — or what to do next.
They leave too much to human interpretation:
- Why did this KPI spike?
- What caused last month’s churn?
- Is this a temporary trend or a deeper issue?
In a world where decisions move fast, static dashboards become bottlenecks.
They inform, but they don’t advise.
And that’s no longer enough.
The Shift: What Makes Analytics Responsive?
Responsive analytics is more than a buzzword. It’s a smarter, more human-centered way to interact with data.
It combines intelligent systems with intuitive interfaces to create dashboards that:
- Accept natural language queries
- Surface relevant insights without prompting
- Flag anomalies and recommend next steps
- Forecast outcomes based on live behavior
- Adjust visualizations dynamically based on your focus
You're no longer interpreting data in isolation.
You're having a guided dialogue with your business performance.
The Technology Behind It
At the heart of responsive analytics is a fusion of modern technologies:
Natural Language Processing (NLP)
Ask questions the way you think. Get answers in plain language.
Machine Learning Models
Find patterns and insights you didn’t know to look for.
Real-Time Triggers and Alerts
Stay ahead of shifts — from supply chain risks to sales fluctuations.
Predictive Engines
Understand what’s likely to happen, not just what already has.
Smart Dashboards
Visuals evolve based on input, role, and strategic priorities.
Together, these systems turn your dashboard into a decision-making assistant — not just a static report.
The Impact: What Changes for Business Leaders?
When analytics talk back, decision-making becomes faster, clearer, and more confident.
Fewer Guessing Games
Data provides explanations, not just numbers.
Faster Response Time
Issues are flagged early, and solutions are surfaced instantly.
Stronger Collaboration
Teams interact with the same insights — not fragmented reports.
Higher ROI from Data Investment
The value of your business intelligence tools multiplies when your team uses them naturally and daily.
Sharper Strategic Moves
Executives move from reactive mode to proactive leadership.
The Vivid Explorer Difference
At Vivid Explorer, we don’t just build dashboards — we engineer responsive data experiences.
We design systems that:
- Adapt to your business logic
- Empower every level of your organization
- Speak the language of your users
- Enable clarity across departments
- Turn data into guidance, not noise
Whether you’re in retail, tech, manufacturing, or service delivery — we help you go from "What happened?" to "Here’s what’s next."
A Final Thought: Don’t Just Monitor — Converse
If your dashboard can’t answer your questions, it’s underperforming.
Responsive analytics isn’t a luxury — it’s the new standard for decision-ready businesses.
The best dashboards don’t just show what’s happening.
They help you understand why, and what to do about it — before you ask.
Ready to Make Your Analytics Talk?
Let Vivid Explorer, powered by VividX, help you create intelligent, intuitive dashboards that think with you — not for you.
Follow us to stay ahead
Similar publication
 AI in Real Life: Turning Prediction into Progress
Predictive intelligence is only powerful when it drives action. AI forecasts mean nothing if they don’t change behavior. At Vividx,…
Read More Beyond the Creative: The Blueprint for a High-Performance, Data-First Marketing Team
Is your marketing team fueled by intuition or intelligence? In 2026, the gap between creative brilliance and market dominance is…
Read More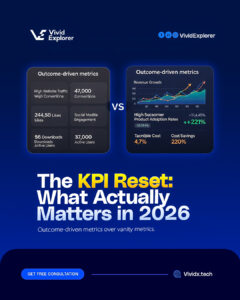 The KPI Reset: Why Your "Success Metrics" Might Be Lying to You in 2026
Is your data telling you the truth, or just what you want to hear? In 2026, many businesses are "rich"…
Read More The Death of the Dashboard: Why 2026 is the Year of Embedded Intelligence
Make Data Invisible, But Omnipresent The most powerful technology is the kind you don't even notice because it’s working for…
Read More